2022 Real Estate Insights – Key Metric Analysis
The real estate sector in 2022 was an arena of contrasts.
After the upheavals and unpredictability brought about by the pandemic in preceding years, the market evolved and presented new strengths and weaknesses.
Vibrant cities that had once been the bedrock of real estate investment faced fluctuating demand, while suburban areas and towns witnessed newfound interest.
Of course, this has been in no small part due to the combination of interest rate changes, remote working trends, and the evolution of digital property platforms—all of which have shaped buyer behavior and real estate investment patterns.
Amid all these shifts, the market also absorbed the impacts of broader economic and geopolitical events, making 2022 an intriguing year for property enthusiasts and investors.
For those vested in the real estate market, either as seasoned investors or newcomers, understanding the nuances of 2022 is invaluable.
This is not just to reminisce about the year that was but to garner insights and lessons that can guide future endeavors.
As we retrospectively analyze the 2022 property market, we unravel its key trends and distinctive markers.
This review is our map to understand where we’ve been and show the potential pathways ahead for real estate investing.
It’s essential to reflect on our achievements and milestones so we can track growing trends and identify emerging opportunities.
Let’s take a detailed look at our key metrics with our real estate year in review 2022.
Key Metrics from 2022
Leads: The year saw an influx of 581,144 leads, showcasing our wide-reaching presence and brand recall in the market.
Each lead represented an opportunity—a potential homeowner or investor reaching out and showing interest in what we had to offer.
Offers: Of those almost 600,000 leads, we translated 47,256 into concrete offers.
This shows how effective a proactive approach in engaging potential clients and understanding their needs can be.
Appointments: Bridging the gap between interest and action, we arranged 33,027 appointments.
These face-to-face interactions are crucial in understanding clients’ requirements, addressing their concerns, and showcasing offerings.
Under Contract: Efficiency and trust through effective communication and relationship management meant we successfully placed 12,647 properties under contract.
Deals Closed: The climax of the pipeline journey with each client culminated in 6,324 successfully closed deals, a testament to the commitment and the seamless experience we provide.
Conversion Rates
From the vast pool of leads, targeted strategies and meaningful follow-ups ensured a 5.68% conversion to appointments.
This percentage signifies that dedication and effectiveness in engaging potential clients are invaluable.
The ability to understand, communicate, and negotiate resulted in 8.13% of the leads translating into tangible offers.
Of these leads, 2.18% went under contract, showcasing once again the benefits of providing tailored solutions when it comes to sealing the deal.
A commendable 1.09% of leads finalized into deals, proving the efficacy of our end-to-end service approach.
The conversion from contracts to closed deals stood at a solid 50.00%, highlighting the strengths of streamlined processes when combined with a dedication to client satisfaction.
Assignment Metrics
Total Assignments: The year saw 5,044 assignments, indicating our reach and effectiveness in connecting sellers with buyers.
Our cumulative assignment fee for the year stood at a whopping $94,036,259.
This figure is a fantastic representation of the benefits of a solid relationship management platform designed and built specifically for real estate investors.
On the financial front, each assignment, on average, brought in a fee of $18,643.
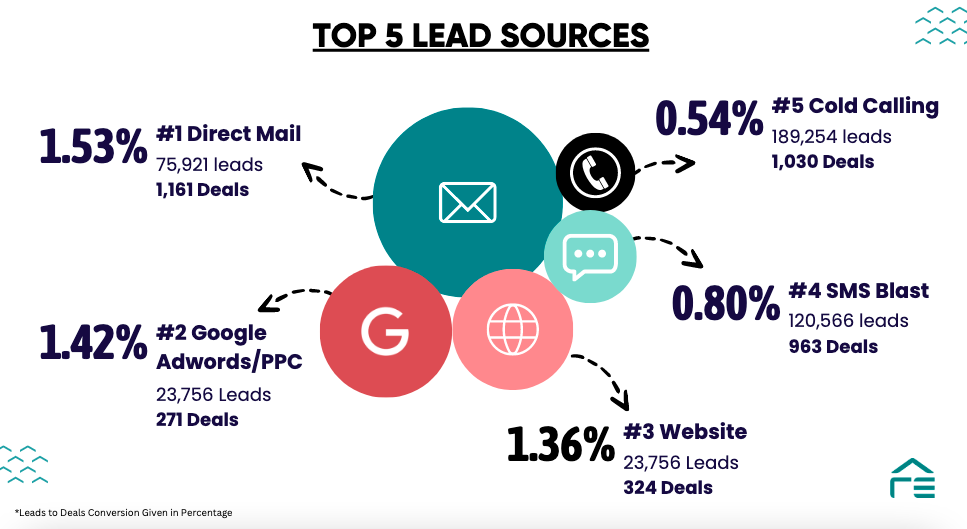
Top 5 Lead Sources
- Direct Mail: 1.53% conversion rate with 75,921 leads, resulting in 1,161 deals.
- Google AdWords/PPC: Conversion at 1.42%, generating 23,756 leads and 271 deals.
- Website: With a 1.36% conversion rate, it produced 23,756 leads and 324 deals.
- SMS Blast: Conversion rate of 0.80% with 120,566 leads leading to 963 deals.
- Cold Calling: Despite a 0.54% conversion rate, it brought in a massive 189,254 leads, resulting in 1,030 deals.
Top 5 Deal Sources
- Direct Mail: An oldie but a goodie, Direct Mail campaigns yielded a 1.53% conversion rate.
With 75,921 leads, this strategy demonstrated its continued relevance, resulting in 1,161 closed deals. - Google AdWords/PPC: Leveraging the power of online advertising, PPC campaigns had a conversion rate of 1.42%.
Through targeted ads, we generated 23,756 leads and successfully closed 271 deals. - Website: Website deals recorded a 1.36% conversion rate with 23,756 potential clients, leading to 324 successful deals.
- SMS Blast: The power of instant communication was evident through SMS campaigns.
A conversion rate of 0.80% from 120,566 leads led to 963 successful deals. - Cold Calling: Proactive outreach through cold calling had a conversion rate of 0.54%.
Yet, the sheer volume of leads (189,254) it brought in made it one of the top strategies, yielding 1,030 deals.
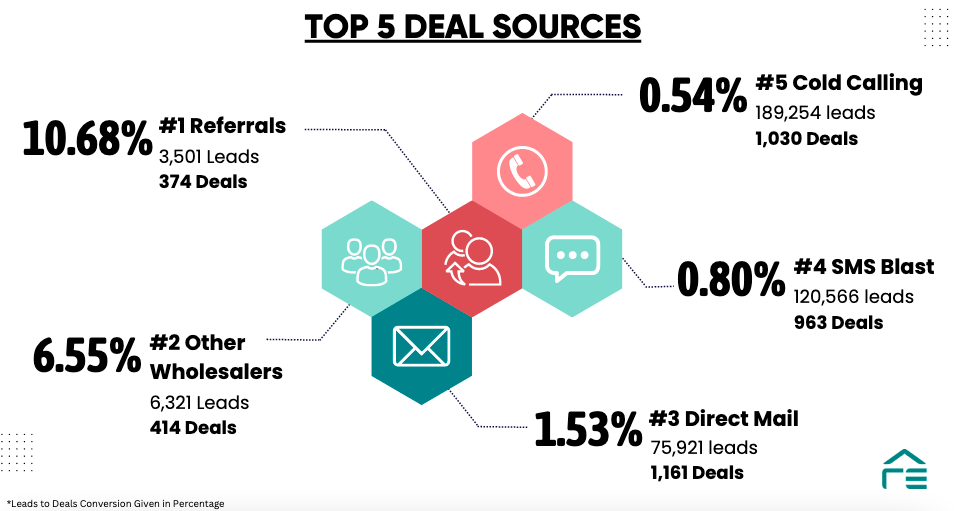
Top 5 Deal Sources
- Referrals: Word of mouth and client recommendations proved powerful, with a 10.68% conversion rate.
A total of 3,501 leads through referrals culminated in 374 successful deals. - Other Wholesalers: Collaboration with other wholesalers bore fruit with a 6.55% conversion rate, accounting for 6,321 leads and 414 closed deals.
- Direct Mail: As mentioned earlier, Direct Mail stood strong, with its 1.53% conversion rate yielding 1,161 successful deals from 75,921 leads.
- SMS Blast: The SMS strategy, with its 0.80% conversion rate, translated 120,566 leads into 963 deals.
- Cold Calling: Despite its lower conversion rate of 0.54%, cold calling’s sheer lead volume (189,254) brought in 1,030 deals
Top 5 Converting Lead Sources
Referrals: A trusted source of leads, referrals brought in 3,501 prospects, from which 374 converted into deals.
Other Wholesalers: Our collaboration with other wholesalers resulted in 6,321 leads and 414 successful deals.
RE Agents: Real Estate Agents played a valuable role, providing 4,251 leads and culminating in 162 closed deals.
Radio Ads: Tapping into the auditory medium, radio ads garnered 7,162 leads, translating into 189 deals.
TV Ads: The visual appeal of TV advertisements drew in 8,598 leads, which led to 202 deals.
Monthly Deal & Assignment Count
Throughout 2022, it became increasingly evident that monitoring monthly statistics provided deeper insights into the trends and seasonality of the sector.
Lead Count & Offers Made
Our monthly lead count fluctuated, with the highest count in September with 59,087 leads and the lowest in February with 34,491.
In terms of offers made, January was the lowest month, with 2,389, and December took the crown with a massive 5,578.
Properties Under Contract & Closed Deals
Tracking properties that went under contract each month showcased the ability to rapidly adapt to market changes and client needs.
The highest count was for August, with 1,191 deals under contract, and the bottom of the pile was January at 740.
When it came to closed deals, June led the pack with 660, and January again took last place at 331.
Conversion Rates (UC to Deals) & Assignment Transactions
The monthly conversion rate from properties under contract to closed deals fluctuated between 15% (January) and 57% (June), with the 2022 average an even 50%.
On the assignment front, the year started off with a low of 334 for January and reached a peak of 512 for August.
Average Bank Balance
Keeping an eye on financial health, the average bank balance throughout the year remained robust.
This metric served as an indicator of deal profitability and overall business health – the 2022 average bank balance was $55,827.
A Summary of 2022 in Real Estate
2022 was an incredible year for investing in real estate, particularly after the difficulties of the preceding couple of years.
Of course, each month provided its set of lessons, with both challenges and victories across the board.
Our deep dive into the metrics has not just been an exercise in numbers but a testament to the robustness of the sector and our ability, as investors, to be flexible and adaptive.
As 2024 proceeds apace, the insights from the previous year’s review are invaluable.
For our community of passionate and dedicated real estate investors, whether you’re a budding real estate enthusiast or a seasoned professional, this information lays the groundwork for making strategic decisions.
Harness the patterns and trends showcased here to carve out your success path in the real estate arena in 2024 and beyond.
Embrace the learnings, anticipate challenges, and set forth with confidence. Here’s to a prosperous future in real estate!